Stochastic Simulation of Nosocomial Disease Propagation
TL;DR
This project focused on developing a computer simulation to model the propagation of Hospital Associated Infections in a hospital based on adjustable parameters and implementing that simulation in the real-world.
Links
Our NetLogo simulation code is hosted on Github here.
Warning: lengthy final report incoming
(1) Abstract
This project developed a NetLogo simulation to model the propagation of Hospital Associated Infections (HAIs) in a medical care center. The layout of the simulation matched the layout of the John A. Burn’s School of Medicine’s (JABSOM) SimTiki Simulation Center. The simulation features several parameters which can be adjusted to model different HAIs and keeps a log of all contacts between agents. A movement script derived from motion studies of healthcare workers was programmed in the simulation for all moving agents. An SIR (susceptible, infected, recovered) model was programmed to track the infectious state of agents in the simulation. All the data generated from the simulation is captured in a MySQL database. Monte Carlo simulations were conducted and analyzed. A physical trial was conducted at the SimTiki Center that mimics the movement script for the NetLogo simulation. The two sets of contact log data were analyzed and compared to validate the accuracy of the physical trial.
(2) Introduction
HAIs are defined as infections a person contracts while in a healthcare facility [1]. HAIs can be contracted by healthcare workers, patients, and visitors in a hospital environment. In the United States, HAIs are responsible for 99,000 deaths and 33 billion dollars in healthcare costs [2]. When an HAI outbreak occurs, an Infection Control Officer (ICO) is sent in to interview the healthcare workers and patients. During these interviews, the ICO asks the interviewee who they were in contact with and when to generate a list of contacts between them. With this contact list, the ICO can try to predict the source of the infection as well as predict persons who may have contracted the infection but are not yet showing symptoms [4]. This method of generating contacts carries with it two major flaws. One being the amount of uncertainty that arises from gathering information based on people’s ability to remember who they met with and when. The other flaw is that this method is prone to omitting interactions with hospital visitors and fomites such as computer stations or supply facilities. As a result, this method is likely to generate an incomplete list of contacts which adds difficulty when predicting the spread of the outbreak. This larger goal of this project is aimed at automating this process of contact tracing. This project represents a first step toward achieving an automated contact tracing system. The remainder of this report is organized as follows. In section 3, the design methods and project modules are explained in a logical order. In section 4, results of the project are explained and elaborated. Section 5 covers anticipated future work to be done during the fall 2017 semester and beyond. In section 6, the project is analyzed with respect to engineering standards. Section 7 contains concluding remarks.
(3) Design methodology
Layout
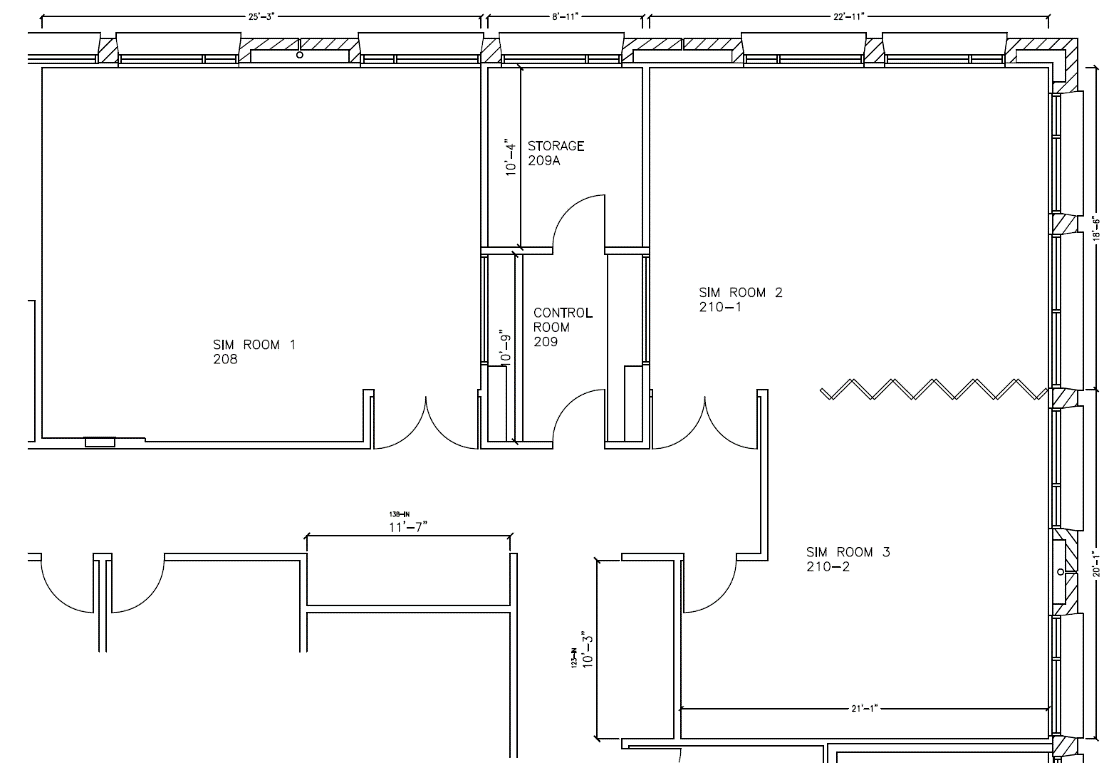
Figure 1. John A. Burn's School of Medicine SimTiki Simulation Center
The NetLogo simulation was modeled after the JABSOM SimTiki Simulation Center shown in figure 1. This layout was chosen to provide realism within the simulation. A physical trial in the SimTiki Simulation Center would later be conducted.
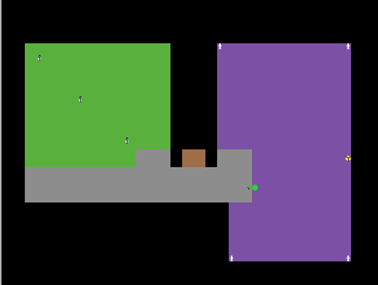
Figure 2. NetLogo simulation layout with agents
As shown in figure 2, the NetLogo simulation closely resembles the layout of the JABSOM SimTiki Simulation Center. The assorted colors in figure 2 denote separate rooms within the simulation. The staff room is colored green, the ward room purple, the hallway grey, and the isolation room brown.
Figure 2 shows a snapshot of the NetLogo simulation populated with several “agents.” In this project, an agent is defined as either a healthcare worker, patient, visitor, or fomite. There are ten agents in the simulation which include three healthcare workers, four patients, one visitor, a computer station and a supply station. As seen in figure 2, the healthcare workers are situated in the green staff room, the patients are in the four corners of the ward room, the visitor waits just outside of the ward room in the hallway, and the computer and supply station are placed near the middle of the ward room.
In all rooms except the isolation room, agents can interact with other agents and generate contact data. When an agent moves into the isolation room, they’re presence becomes invisible to the other agents and are unable to generate contact data. This allows the simulation to model a moving agent leaving and returning to the simulation.
Movement script
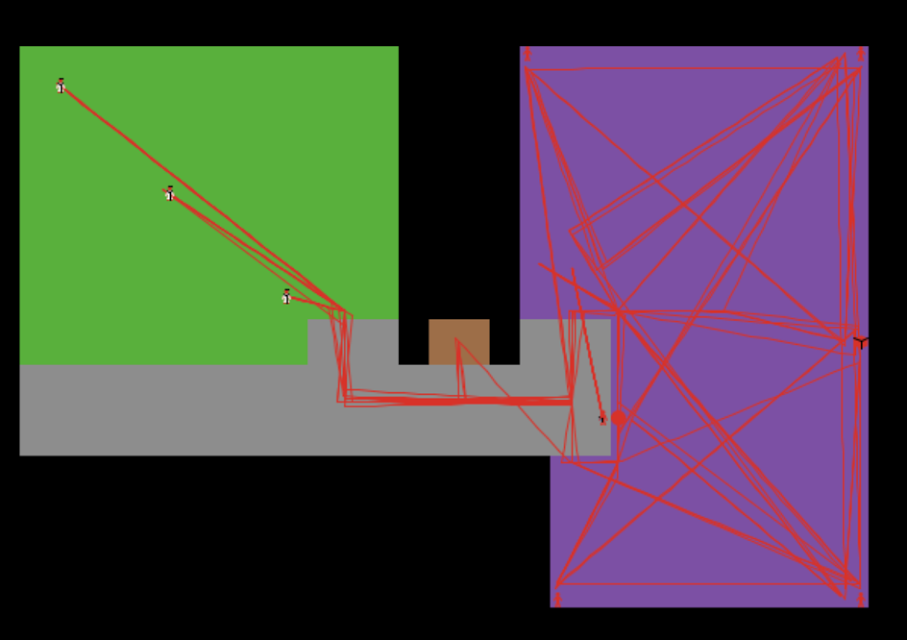
Figure 3. NetLogo simulation layout with agent's mapped movements
Figure 3 shows the NetLogo simulation overlaid with red lines. These red lines denote the various paths of the moving agents in the simulation. To simulate hospital activity, each moving agent is programmed to follow a movement script that spans an equivalent of 30 minutes in real-time. The motion script was modeled from two observational studies conducted by WOMBAT and Michael Peter Abbey from Griffith University [5, 6]. The results of these studies report the average amount of time a healthcare worker spends doing specific tasks at the hospital. These results were used to create a movement script for each healthcare worker that follow these averages. At the end of the 30-minute simulation duration, all moving agents return to their starting positions. This allows the simulation to be looped repeatedly to simulate longer durations of hospital activity.
Contacts
The radial distance at which the probability of an infection transferring between agents is non-zero is called the Effective Distance of Infection (EDOI). When distance between two agents in the simulation is lower than the EDOI, a “contact” occurs between the two agents. During contacts, agents can infect one another.
To choose meaningful EDOIs for the simulation, categorization of the different methods of HAI transfer were investigated. A close contact with an EDOI of 2 feet can simulate a physical touch contact. Clostridium difficile is one example of an infection that can only be transmitted through physical contact [7]. A droplet contact has a slightly larger EDOI that ranges from 5 feet to 10 feet. Pertussis, better known as whooping cough, can be contracted by the droplet method of transfer [7]. Airborne transfer methods result in large EDOIs and likely spread throughout the room in which it is contained. For this simulation, a EDOI of 42 feet is sufficient to simulate the airborne method of transfer. Tuberculosis is an example of an airborne HAI [7].
SIR Model
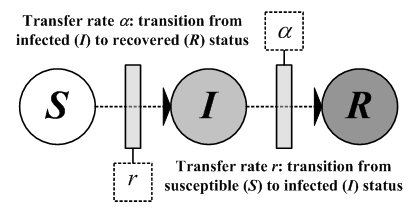
Figure 4. SIR model [8]
The SIR model, shown in figure 4, classifies an agent’s status during the simulation. A susceptible status means that the agent may contract an infection if it has a contact with an agent with an infected status. It is important to note that in the real-world, persons may have immunity to the HAI of concern. The simulation simplifies this aspect by assuming every agent in the susceptible state has a non-zero chance of contracting the simulated HAI. An agent in a susceptible state is denoted in the simulation by being colored white as shown in figure 2.
An infected status means that the agent carries the HAI and is prone to spreading the HAI to other agents during contact sessions. Randomness is used to determine whether an infection transfers from an infected agent to a susceptible agent during a contact session. The inverse of the range of values the random number can have is called the Probability of Infection (POI) and can be widely changed to vary the contagiousness of the simulated HAI. The random number’s value is checked during every tick of the program clock. If the random number is equal to one, an infection transfer occurs between the two agents. As shown in figure 3, an infected agent is colored red to symbolize their infected state.
While an agent is in the infected state, they do not show symptoms as to simulate them being in the HAI’s incubation period. In the simulation, the incubation duration can be changed to represent different HAIs. Once the agent begins to show symptoms of their infection, they transfer from the infected state to the removed state. To simplify the model, the simulation assumes that once an agent reaches the end of its incubation period, they immediately begin to show symptoms of infection and they are also replaced on-the-spot with a susceptible agent. In the simulation, this phenomenon is shown as an agent transitioning from red to white.
Contact tracing
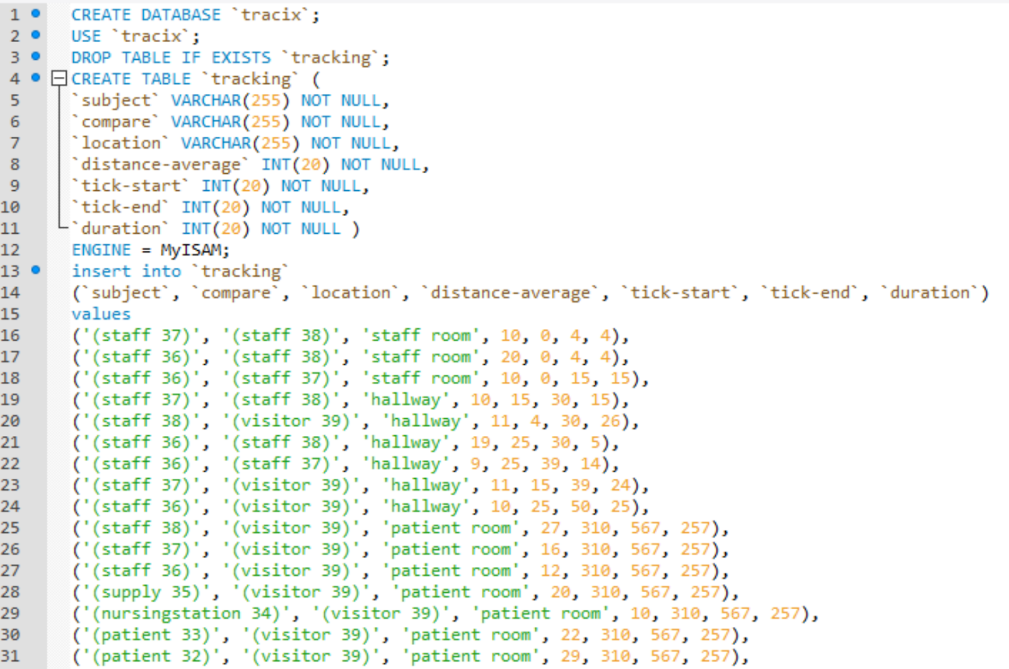
Figure 5. Sample output to the database
A contact tracing method was implemented to capture a log of all contacts generated from agents moving about in the simulation. The contact tracing method also displays contact data in the NetLogo interface and generates a log file that is sent to a database for analysis. Figure 5 shows a snippet of the contact log generated from a single run of the simulation.
The termination of a contact session in the simulation generates an output that contains two data points of interest. One data point is the calculated average distance between the two agents and the second is the duration of the contact session. Two agents that share a contact session with a short average distance and long duration will have a higher chance at transferring an infection than a short contact session with a large average distance. Capturing these two data points about each contact session is the first step toward automating the work of the ICO and can provide a way to predict the spread of the HAI in retrospect.
MySQL
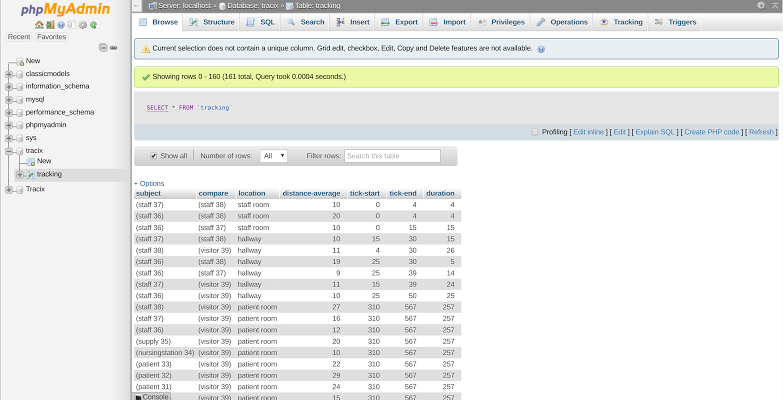
Figure 6. LAMP stack platform
When researching suitable databases to use for this project, the choice narrowed down to either MongoDB or MySQL. MySQL was eventually chosen over MongoDB due to its relational characteristics. A relational database is structured to recognize relationships between inputs and offers computational methods in which to analyze the contact log. The database is setup in Ubuntu, a Linux operating system. A LAMP stack, which includes Linux, Apache, MySQL, and PHP, was implemented to provide the necessary peripheral functions for the database. With this platform, the database can be easily accessed, updated, and monitored. From NetLogo, the contact log is written to a .sql file in a predetermined file format so that the data can be directly uploaded into the database. Figure 6 shows a snapshot of the LAMP stack and displays the contact data presented in figure 5.
Monte Carlo
A Monte Carlo simulation is a method to stochastically generate a numerical result by repeating a simulation with randomness. For this project, randomness is introduced when determining the transference of a HAI during a contact session and the numerical result of interest is the average number of infected agents over a period of two days. To simulate a period of two days, the NetLogo simulation was looped continuously 96 times. This constitutes one “run” of the simulation. To repeat the simulation for the Monte Carlo method, we conducted 20 runs which constitutes one “group” of runs. In total, we conducted 32 groups of runs.
To generate contact data based on the different methods of infection transfer, four different EDOI were chosen. For each EDOI, we simulated eight different POI values to represent varying levels of contagiousness. These pairings of EDOI and POI generate a total of 32 Monte Carlo simulation results. A total of 640 runs were completed to generate the results. Each group of runs took approximately two hours to simulate.
John A. Burn’s School of Medicine SimTiki Trial
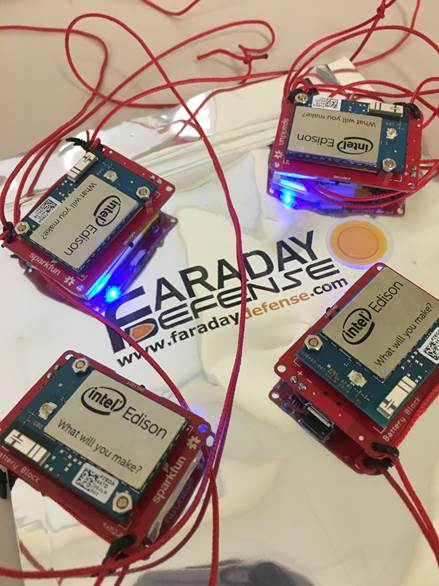
Figure 7. Intel Edison devices
Figure 7 shows some of the Intel Edison devices that were used to conduct a physical trial of the NetLogo simulation at the JABSOM SimTiki Center. A contact tracing program written in C++ was programmed onto 12 Edison “tags.” Each tag is battery powered to provide the portability needed for the tags to be worn and placed throughout the simulation center.
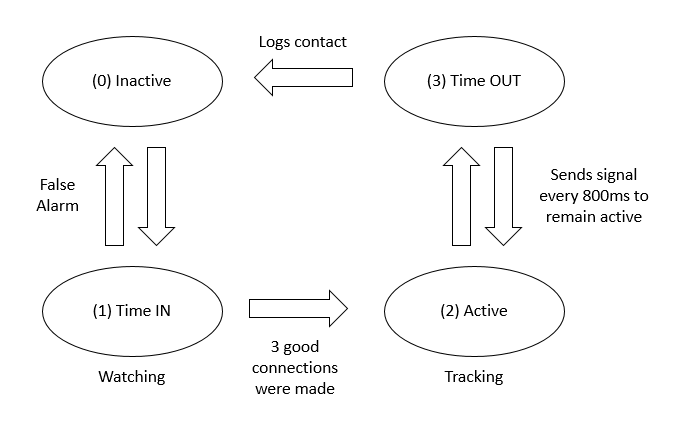
Figure 8. State diagram of a contact
Figure 8 shows a state diagram of how a contact is determined, established, and logged because of the tag’s programming behavior. Each tag begins at state 0 which is the inactive state. When inactive, the tag is actively searching for nearby tags but has failed to locate anyone. After the tag initially sees another tag’s presence, the pair of tags will enter the watching state, denoted as state 1. If three consecutive acknowledgements are made between the tags, they both transition to state 2 and are now actively tracking the contact session between them. If the tags fail to record three consecutive acknowledgments, they transition directly back to state 0. To maintain an active connection, each tag must receive a confirmation of the other tag’s presence every 800ms. When the contact times out, each tag generates an entry into its contact log and returns to the inactive state.
In preparation for the physical trial to be conducted at the JABSOM SimTiki Simulation Center, several preliminary trials were conducted. The primary concern with conducting the trial was radio interference between tags. During a preliminary trial, it was found that all tags could follow the state diagram shown in figure 8 despite interference occurring between the tag’s Bluetooth signals. Had there been substantial radio interference, more Bluetooth channels would have been needed for the tags to communicate successfully or another communication method be implemented. As the project continues, the use of more tags may cause significant interference and corrupt signal data between tags. Another discovery made during the preliminary trials was that each tag needed to be time synced. Time sync ensures that when consolidating each tag’s contact log, the recorded time stamps are synonymous. This problem was resolved by having each time reference their clocks to a laptop using the Network Time Protocol.
The official SimTiki Trial was conducted on April 23rd and mimicked the programmed movement script for the NetLogo simulation. Volunteers Curtis Frifeldt, Cristina McLaughlin, Tamra Oyama, and Jie Zhou, played the roles of the moving agents in the NetLogo simulation. Each volunteer had with them an observer that would observe and timestamp their partner’s actions. The motion script was performed twice at the official SimTiki Trial. All movers and observers were given stop watches and scripts to follow. The motion script was performed twice. The difference between the first and second run was the use of Faraday bags. In the first run, all movers simply wore their Edison tags and followed the motion script. In the second run, all the movers and the patient tags were placed into a faraday bag when the mover and patient were assigned to meet. This simulated the patients being in separate rooms or being separated by a large distance. When only the two tags are in the Faraday bag, there is only communication between those two tags. As soon as the Faraday bag is opened, the tags can see other tags again and start contacts.
(4) Data collection and analysis
Monte Carlo
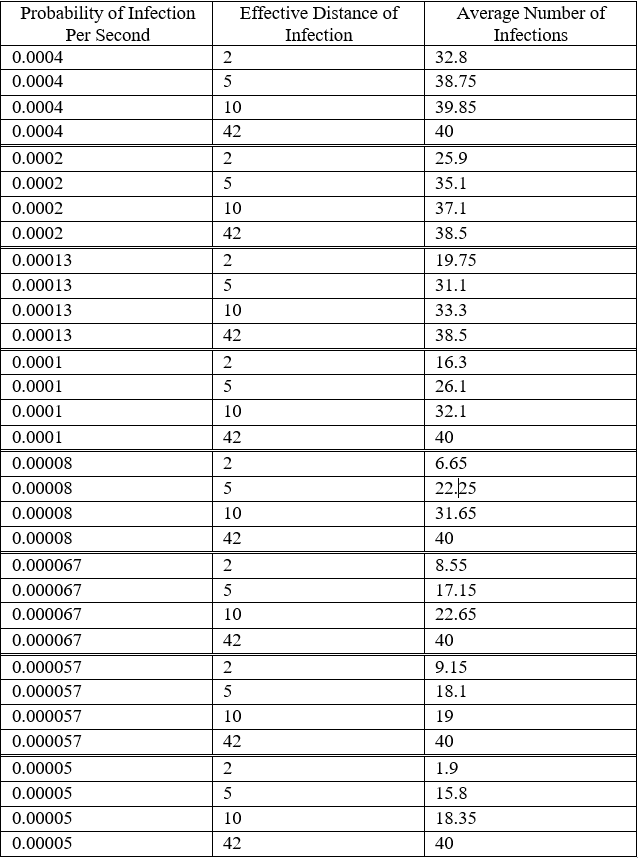
Figure 9. Monte Carlo results
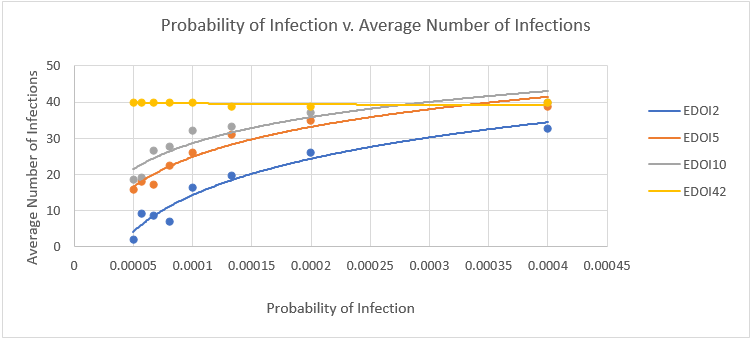
Figure 10. Monte Carlo graph
The color of each data point on the graph denotes the EDOI. There are four distinct colors used to represent the different methods a HAI can be transmitted during a contact. For example, a blue dot represents an EDOI of 2 feet, which simulates a touch contact between two agents in the simulation. A data point’s position along the x-axis represents the chosen POI for that Monte Carlo simulation. For each EDOI, we simulated eight different POIs to see how varying the contagiousness of an infection would affect how many agents got infected over the 48-hour run. A data point’s position along the y-axis represents the average number of infected agents for that Monte Carlo simulation.
As shown by the trend lines, increasing the EDOI resulted in more agents becoming infected over the two-day period. The graph also shows that by increasing the POI the infection spread more rapidly and results in an increase in the total number of infected agents. These general behaviors follow predicted, and shows that our NetLogo model follows the general trends of how an infection outbreak should behave in a hospital setting.
John A. Burn’s School of Medicine SimTiki Trial
The two runs during the physical trial generated a list of contacts that is distributed throughout the 12 tags. The current method of consolidating each tag’s contact data and comparing the results has not yet been automated and requires manual merging and analysis techniques. Therefore, the analysis process and takes a lot of time and is currently prone to human mistakes. Automating this process is currently a future goal of this project.
During preliminary analysis of the SimTiki Trail contact data, it was found that two of the tags had shut down their contact tracing program prematurely during the first physical trial. Further investigation revealed that the tag’s time sync had failed to activate causing the premature shut down. This issue will be worked out by conducting more practice trials and rigorous testing of the tag’s ability to sync with one another.
A complete analysis of the data from the physical trial is currently being worked on. After preliminary analysis, the contact data somewhat resembles the contact data generated from the Monte Carlo simulations. A close resemblance of the data between the physical trial and the Monte Carlo simulations would give validation that the NetLogo simulation can be replicated in a real hospital setting.
(5) Engineering standards
Economic
Along with fulfilling EE 496 requirements, this project also doubled as an Undergraduate Research Opportunities Program (UROP) project. The project was partially funded by UROP and the Hawaii Pediatrics Association for the spring 2017 semester and has been awarded funding to continue research and development for the fall 2017 semester.
Work on this project has the potential to directly impact the healthcare costs of dealing with HAIs. In 2008, the Centers for Medicare and Medicaid enacted a rule that reduced hospital Medicare pay for preventable medical complications [3]. HAIs fall under the category of preventable medical complications and therefore it is in the best interest of hospitals to reduce HAI count as much as possible. With applying a full-scale implementation of our JABSOM SimTiki live trials, a hospital would have the means to combat outbreaks of HAIs effectively.
Environmental and Sustainability
This project did not involve environmental concerns and did not relate to any sustainability issues.
Manufacturability
This project did not involve any manufacturing or fabrication aspects. The Intel Edison devices were purchased and the anticipated Intel Curie devices will be purchased with the assistance of UROP funding in the fall 2017 semester. Work towards this project involved only research, programming, and data analysis.
Ethical
There is little to no available data on the propagation characteristics of infectious diseases within a hospital setting. Generating such data would be unethical as it would involve purposely infecting human subjects and closely monitoring their behavior while under hospital care. As a result, the available data on this subject is obscure and limited.
The project created a method to study such propagation characteristics in an ethical manner through simplifying and simulating a hospital environment. Using a computer simulation allowed for the study of infectious disease propagation after fixing a specified EDOI and POI. Although the values used in the Monte Carlo simulations were not based on clinical data, they can be widely varied to provide an ethical method to study HAI propagations.
Health and Safety
Improvements to the health and safety of persons occupying a hospital represents the larger goal of project. Using current methods of contact tracing, there are still roughly 720,000 HAI cases in American acute care facilities that result in 75,000 patient deaths every year [1]. Improving upon the current method of tracing contacts via personal interviews has the potential to reduce the number of HAI cases. Improvements may also offer methods to predict the infectious state of individuals allowing hospitals to provide targeted preemptive treatments.
The closest system that has been developed to trace contacts in a hospital is a nurse location system. This system tracks the location of healthcare workers with respect to the hospital itself. As a result, this system cannot generate a list of contacts that occur between two or more persons. This system can only aid the Infection Control Officer with understanding the general location of a healthcare worker in the hospital at a given time.
In the Edison system, a device only cares about its proximity to other devices and does not track its own location with respect to the hospital. This allows the system to generate a contact list that contains relevant information about a person’s exposure without the need to conduct interviews.
Social and Political
There are no social or political aspects related to the scope of this project.
(6) Future Work
The next step for this project is to migrate from the Intel Edison device to their new chip, the Intel Curie. The Curie is of interest due to its smaller size than the Edison which reduces power consumption and reduces the degree to which these devices interfere with hospital activities. The Curie also has a 6-axis accelerometer and gyroscope which can potentially be used to provide simple descriptions of a person’s orientation or current activity [9]. Since the Bluetooth signal strength can change drastically based on the direction a person is facing, the 6-axis accelerometer and gyroscope may provide methods to interpret these varying signal strength contact sessions more accurately.
The project has been funded by the UROP for the fall 2017 semester. With this funding, 30 Intel Curie devices will be purchased to realize previously stated improvements and to conduct a larger physical trial at the JABSOM SimTiki Center.
References
[1] “Healthcare-associated Infections.” Centers for Disease Control and Prevention. Centers for Disease Control and Prevention, 25 Oct. 2016. Web. 30 Apr. 2017.
[2] “AHRQ’s Efforts to Prevent and Reduce Health Care-Associated Infections.” AHRQ—Agency for Healthcare Research and Quality: Advancing Excellence in Health Care. U.S. HHS: Agency for Healthcare Research and Quality, 02 Oct. 2014. Web. 01 Mar. 2017.
[3] “Hospital-Acquired Conditions.” CMS.gov Centers for Medicare & Medicaid Services. Centers for Medicare and Medicaid Services, 19 Aug. 2015. Web. 30 Apr. 2017.
[4] Admin. “Hospital Infection Prevention and Control Guidelines.” (n.d.): n. pag. http://www.ncdc.gov.in/writereaddata/mainlinkfile/File571.pdf. Centers for Disease Control and Prevention. Web. 29 Apr. 2017.
[5] Ballermann, Mark A., et al. “Validation of the Work Observation Method by Activity Timing (WOMBAT) method of conducting time-motion observations in critical care settings: an observational study.” BMC medical informatics and decision making 11.1 (2011): 1.
[6] Abbey, M., Wendy Chaboyer, and M. Mitchell. “Understanding the work of intensive care nurses: a time and motion study.” Australian Critical Care 25.1 (2012): 13-22.
[7] “Part I: Review of Scientific Data Regarding Transmission of Infectious Agents in Healthcare Settings.” Centers for Disease Control and Prevention. Centers for Disease Control and Prevention, 25 Nov. 2009. Web. 01 Mar. 2017.
[8] Huang, Chung-Yuan, Chuen-Tsai Sun, and Ji-Lung Hsieh. “Simulating SARS: Small-World Epidemiological Modeling and Public Health Policy Assessments.” Journal of Artificial Societies and Social Simulation 7.4 (2004): n. pag. Web. 29 Apr. 2017.
[9] http://www.intel.com/content/dam/support/us/en/documents/boardsandkits/curie/ Intel_Curie_Module_Datasheet_V1.21.pdf
[10] https://cdn-shop.adafruit.com/datasheets/EdisonDatasheet.pdf